Announcing Correlation Studio
On June 1st, 2026, a powerful new SaaS statistics application was unveiled. Correlation Studio brings the insights of correlation data science to expert users looking for no-code solutions, and opens it up to anyone who wants to do research on correlation models. It combines search, experiment & discovery statistics workflows with a publishing platform and social media fabric.
Correlation Studio – Welcome
Users bring their own data in the form of CSV and Excel files, or discover it with our Dataset Wizard. By providing only a topic & description, the wizard harnesses the power of Claude, Gemini and Grok to source files for downloading, ingestion & analysis. In this example we’ve asked for S&P 500 datasets with a simple query and can see the providers have all returned results. The wizard has stripped out bad results and presents only validated links for downloading.
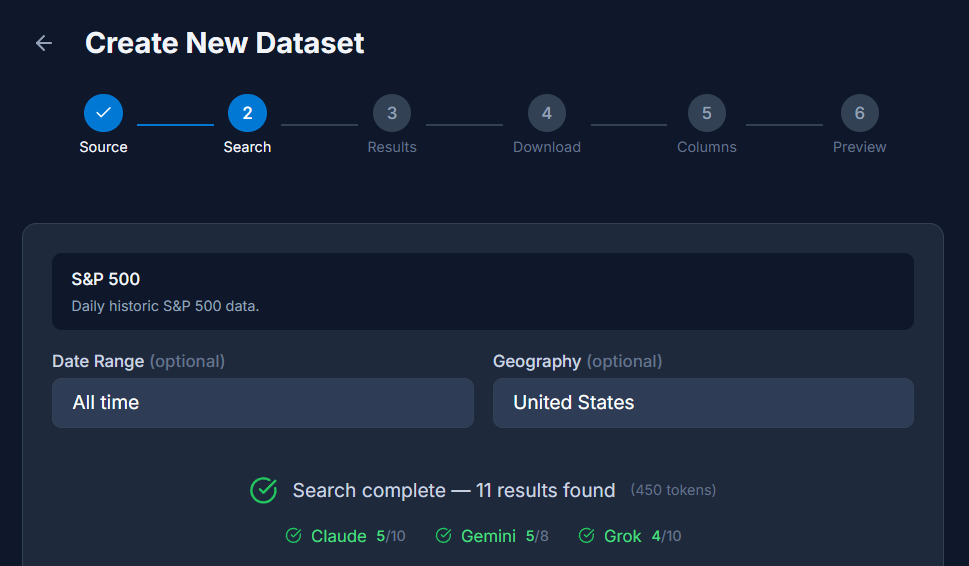
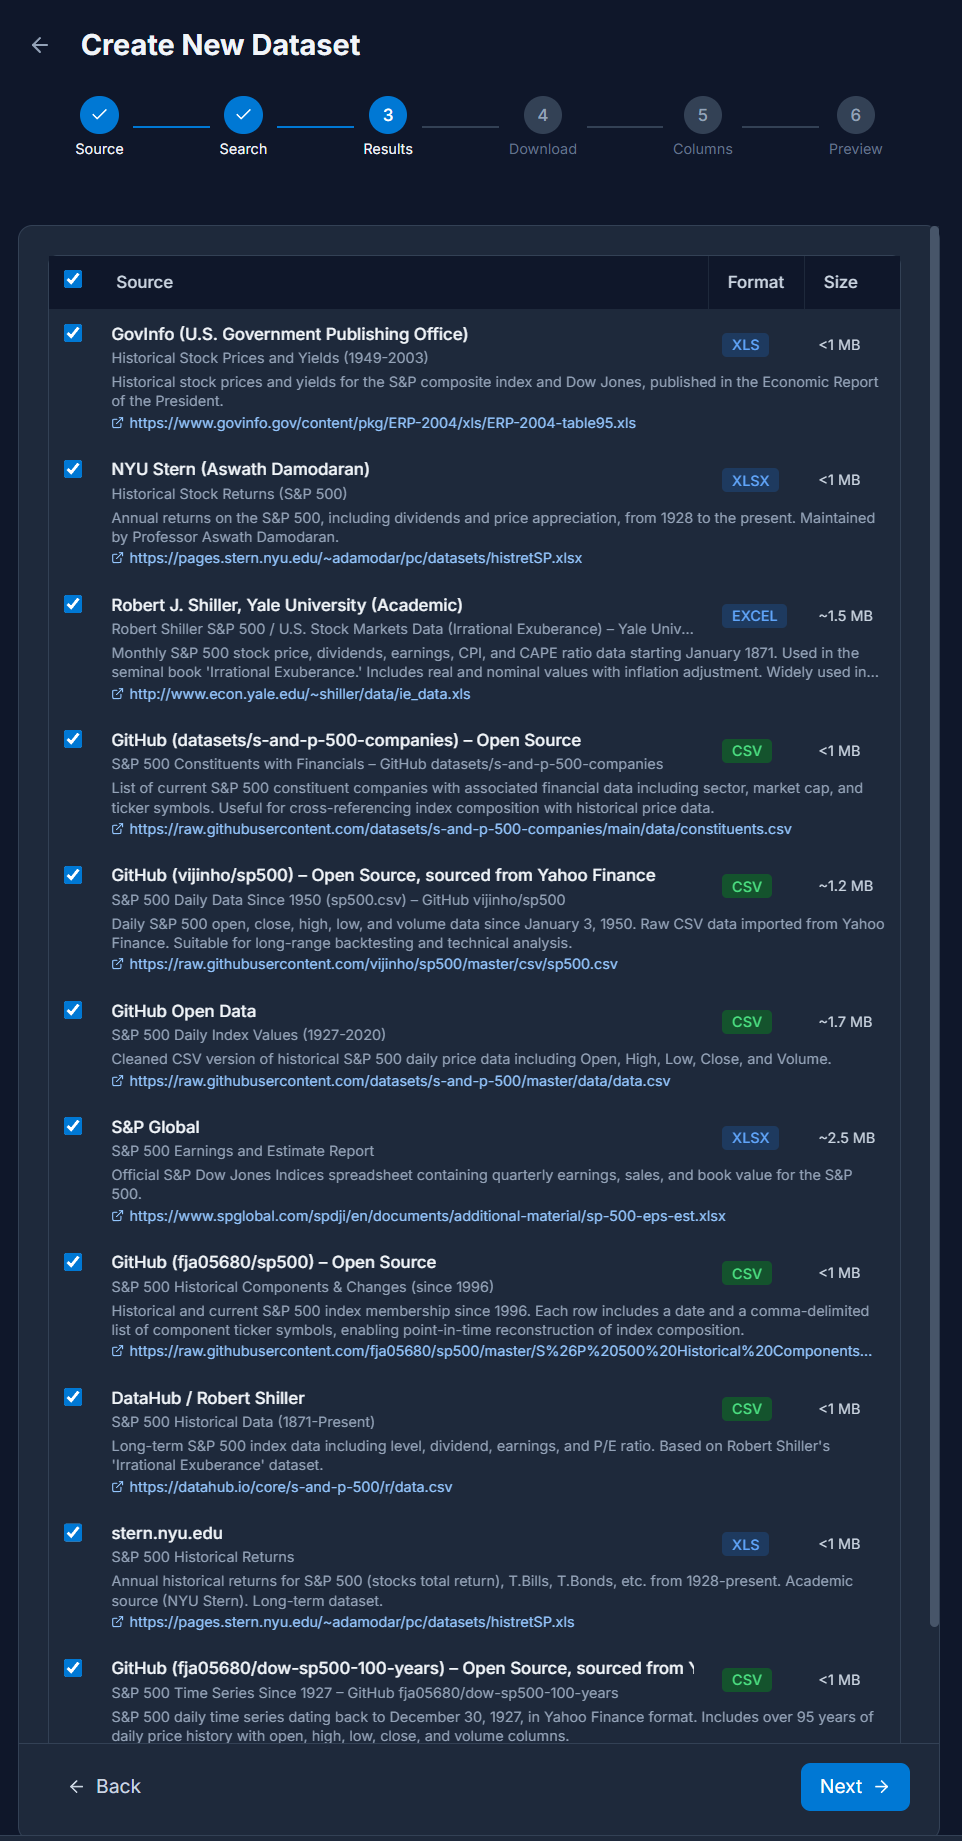
Stepping through the wizard, users can review the links sourced by the AI providers and select datasets for downloading based on rich descriptions, format & size parameters.
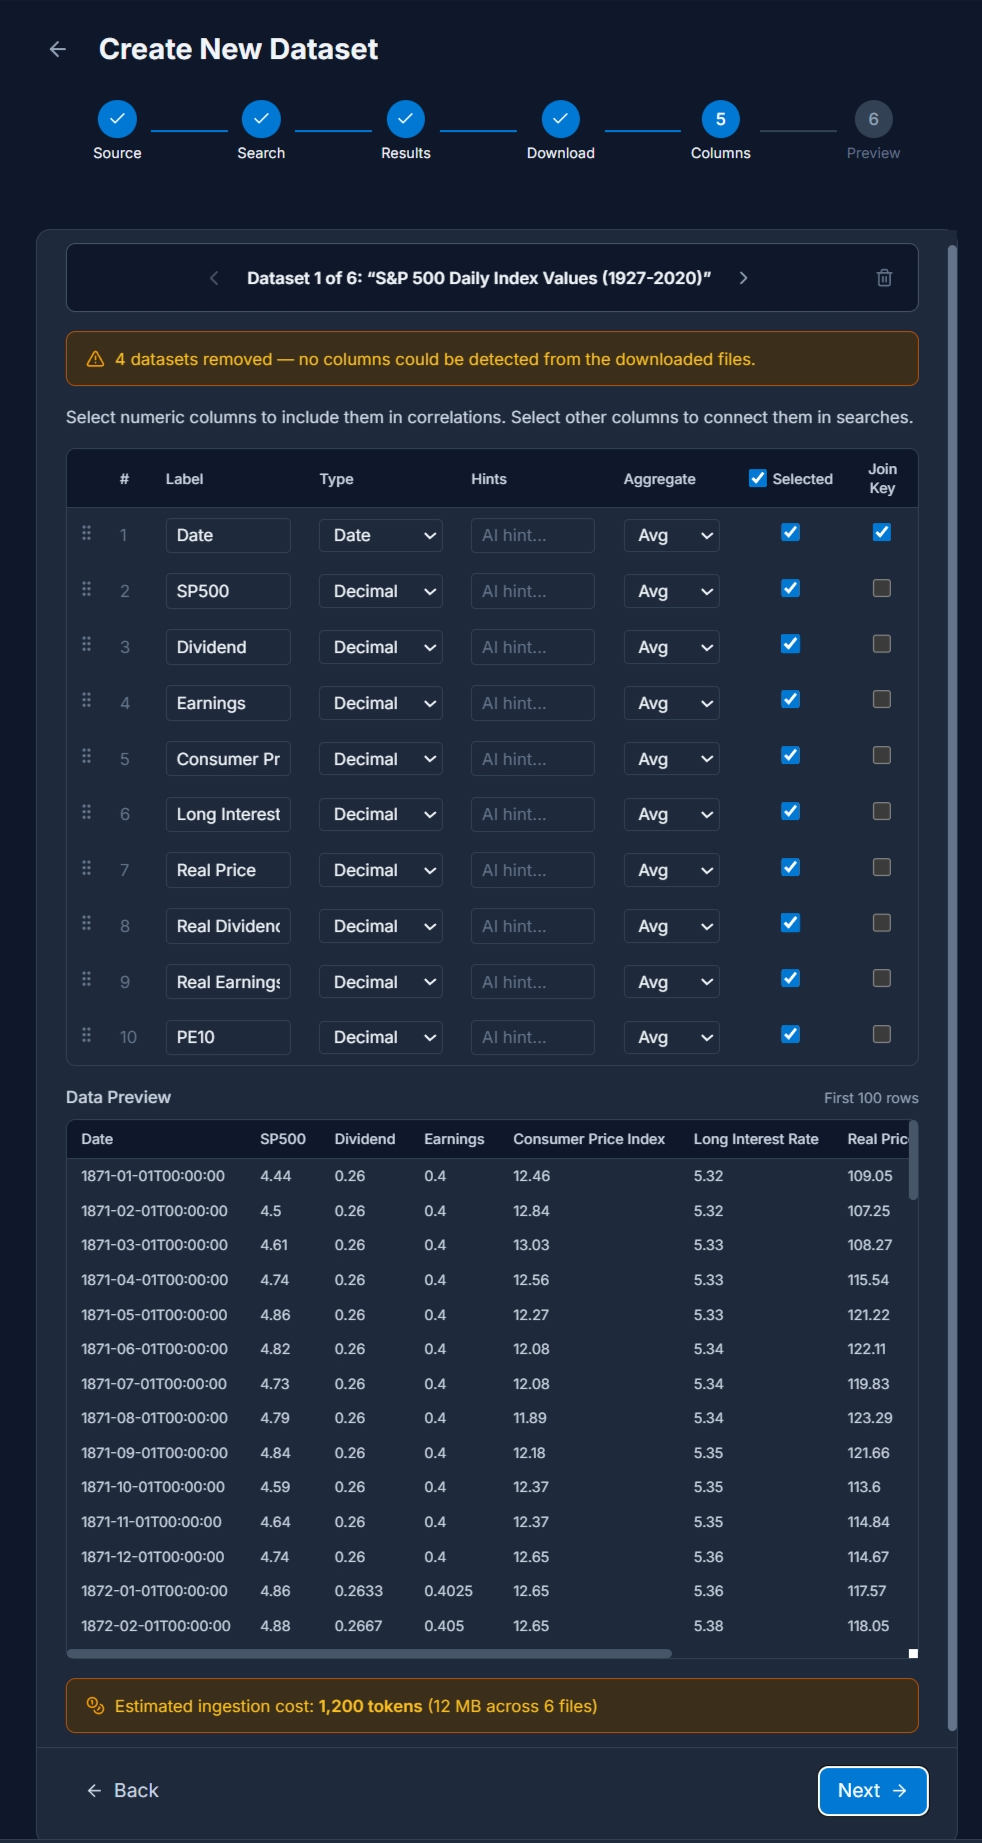
After downloading, the Datasets can be examined and column mappings provided. Each column that is selected will be included in the ingested dataset and available for Discovery drill-down. For Datasets with unique keys such as time-series data, a Join Key will be specified for one or more of the columns. This column is used to combine datasets together for correlation analysis. Two datasets must share common key values or the same row-order in order to be used in Experiments.
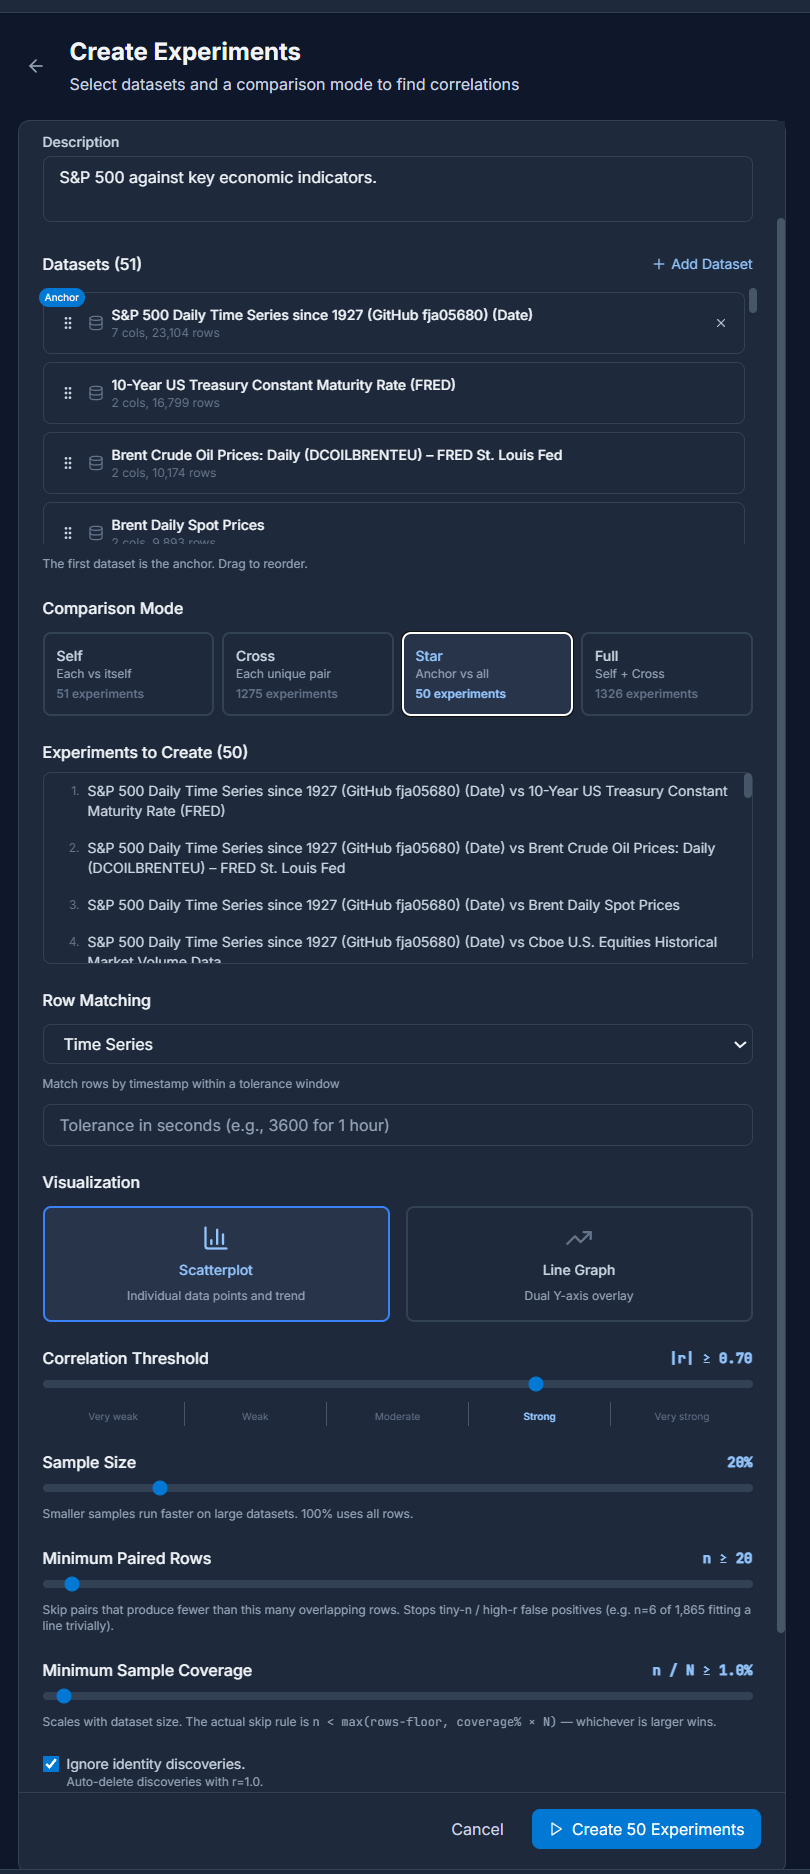
Using the Create Experiment workflow, users combine Datasets together and prepare to analyze each column against every other. Experiments can consist of Self correlations, which examine every column in a single Dataset against every other, Cross correlations which examine every column of every Dataset in the experiment, or Star correlations which examines an anchor dataset against every other. A Full correlations option is provided to merge all three correlation types.
Here we’re creating a Star Experiment for the S&P 500 Daily Time Series, so the Row Matching mechanism is Time Series. Other values include Shared Key, useful for connecting datasets with information like stock ticker symbols, and Row Offsets, used when the Datasets are from the same export process and known to be linked by cardinal offset.
Additional parameters to the Experiment workflow include Sample Size, which can be used to select idempotent samples of the target Datasets, Minimum Paired Rows and Minimum Sample Coverage which ensure healthy statistical assessments.
After the Create Experiments workflow is complete the user is presented with an overview of all of their Experiments. There may be many, as in this example of 50. Each Experiment row can be expanded to reveal the Discoveries it contains, and each Discovery row can be expanded to reveal its chart.
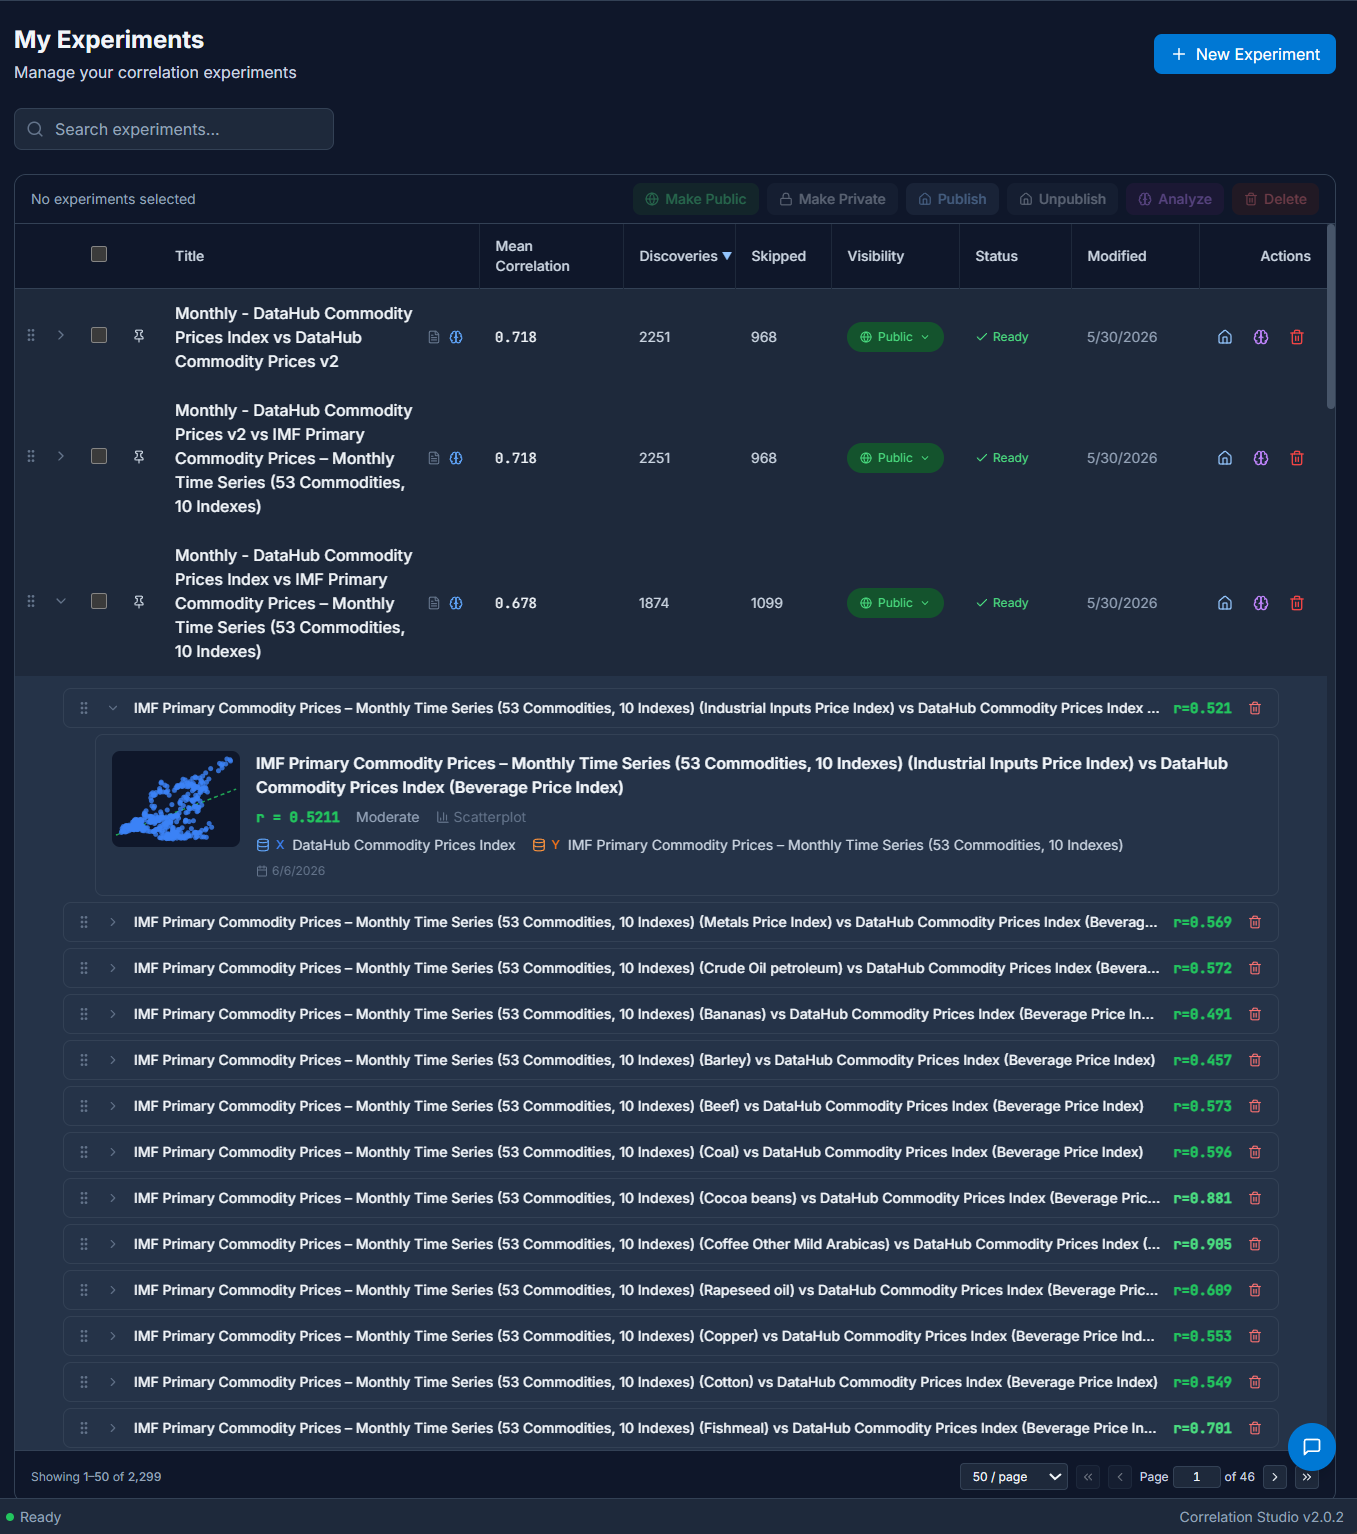
Depending on the parameters of the Experiment, the columns in the Datasets and the number of rows connected by there may be anywhere from one Discovery to thousands. The Experiments detail page includes all the metadata and parameters of the Experiment, and a table of Discoveries. Click through to each one for a drill-down view.

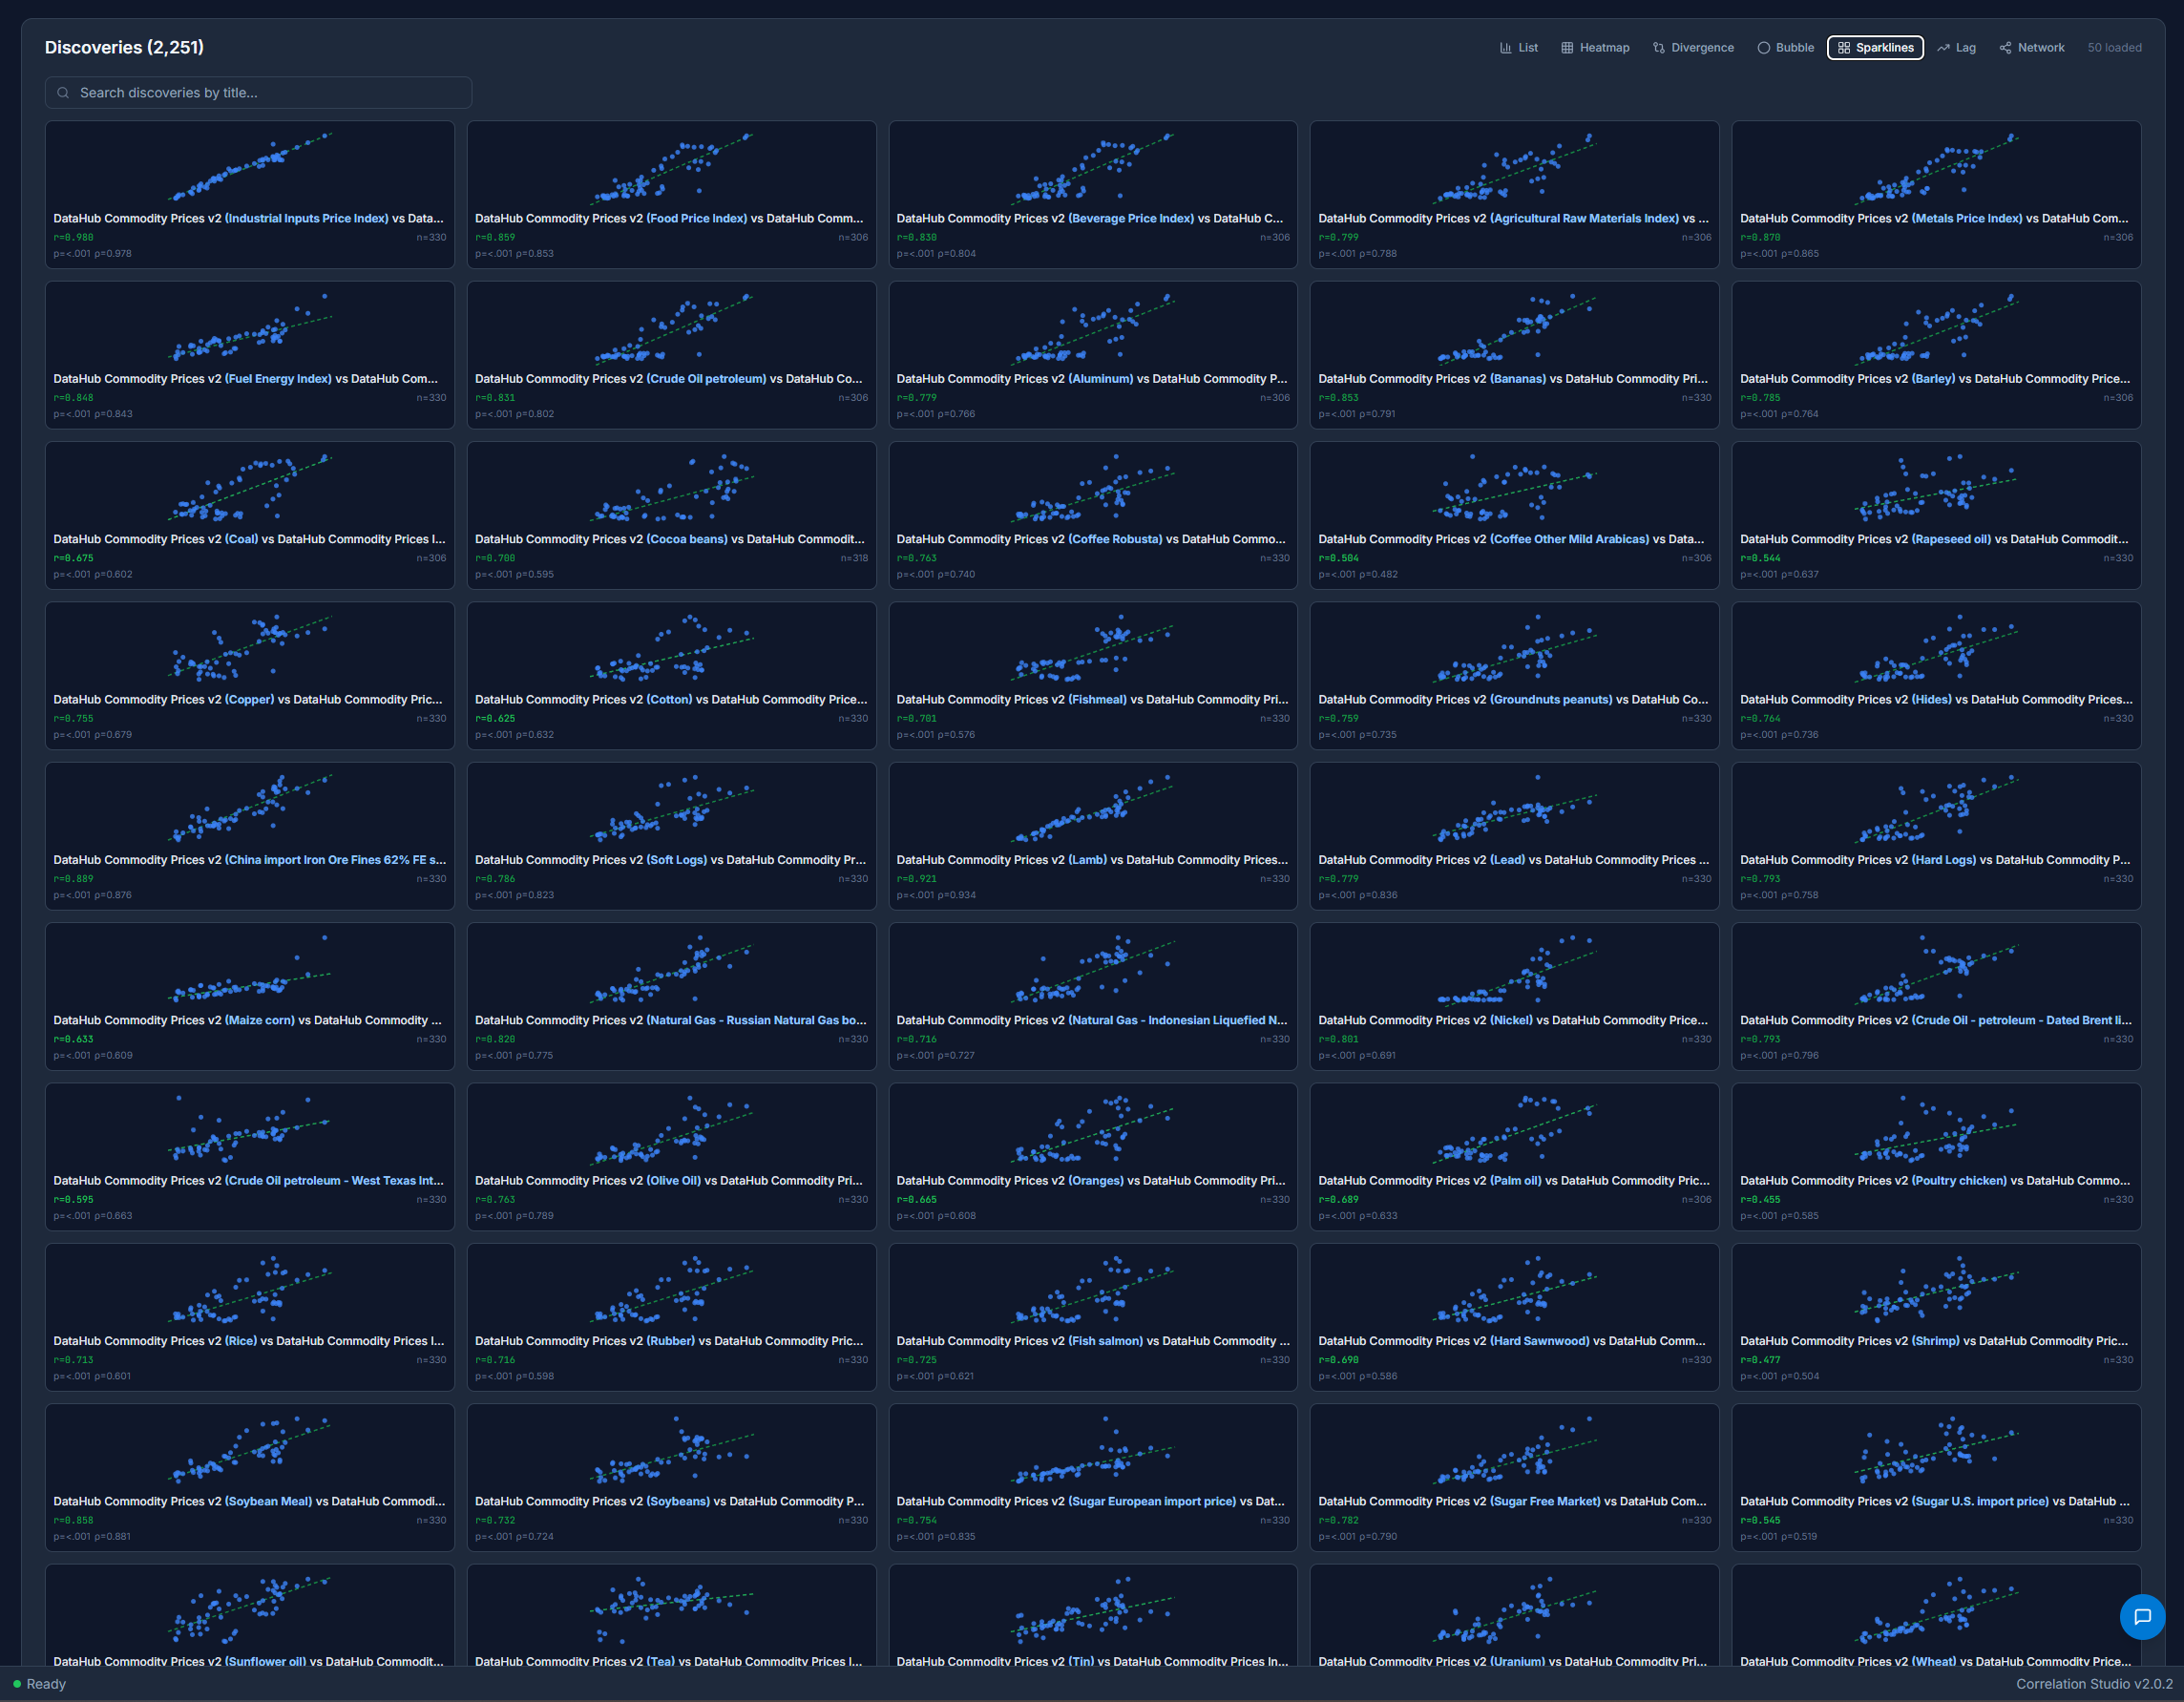
Choose the Sparklines view to see an overview of all the scatterplots rendered on the same page, useful for spotting trends.
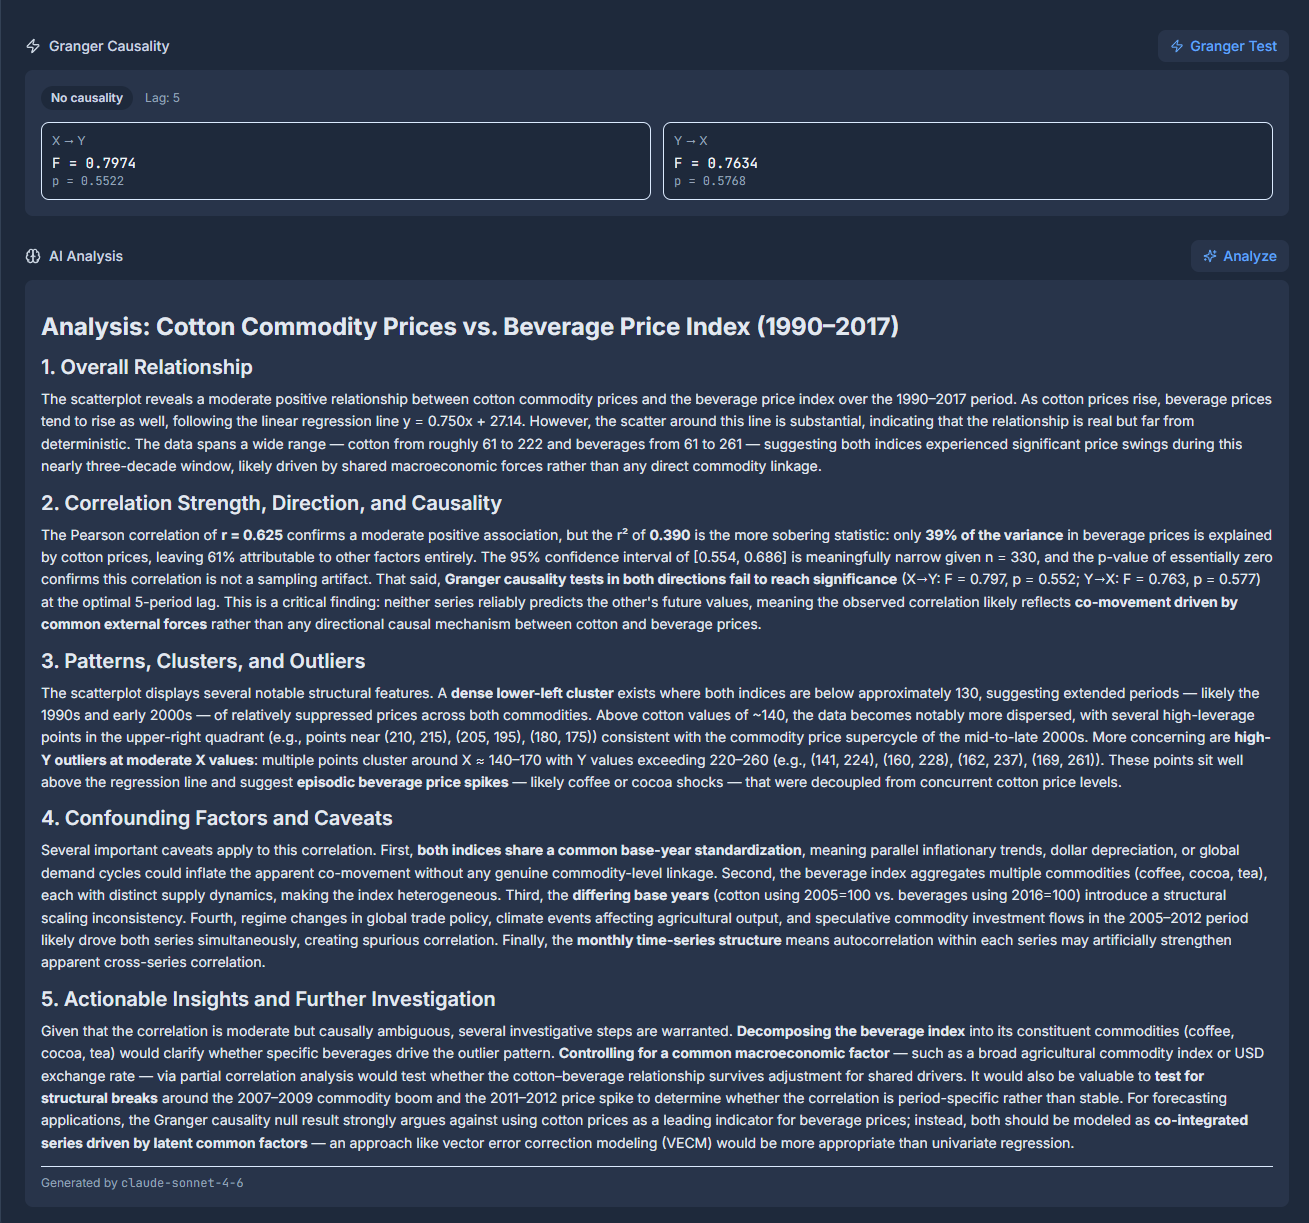
Click-through on any Discovery to view a detailed page with metadata, scatterplots & line charts with drill-down capability and geospatial views where available. The datapoints, P-values, Granger Causality & other metadata are all part of the Discoveries that are analyzable.

Each Discovery can be analyzed with the Granger Analysis and AI Analysis buttons.
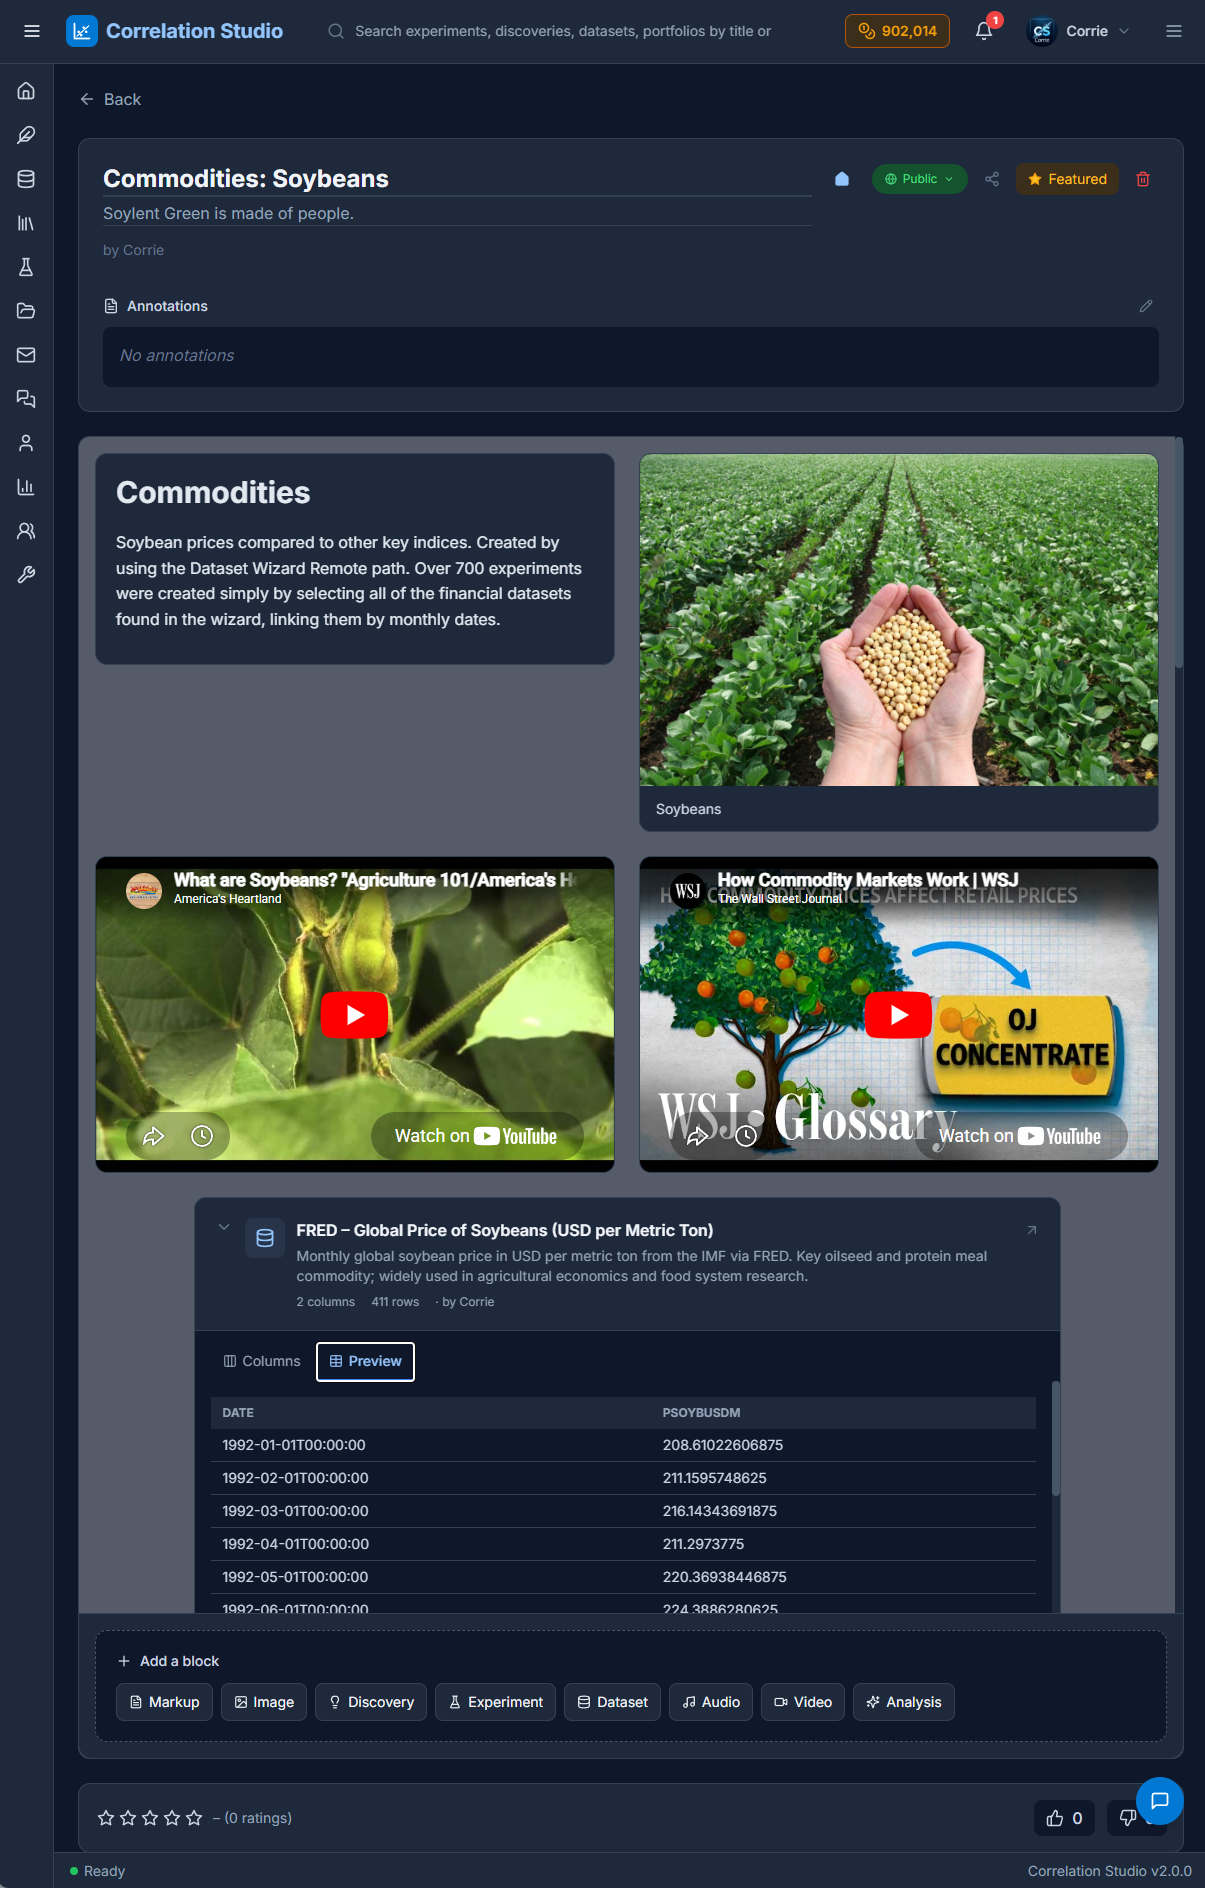
Users compile their Datasets, Experiments and Discoveries into shareable Portfolios that combine them with markdown & multimedia to make interactive presentations featuring their podcasts & lectures.
It’s AI all the way, from the Dataset Wizard to Claude analysis for Datasets, Discoveries and Portfolios.
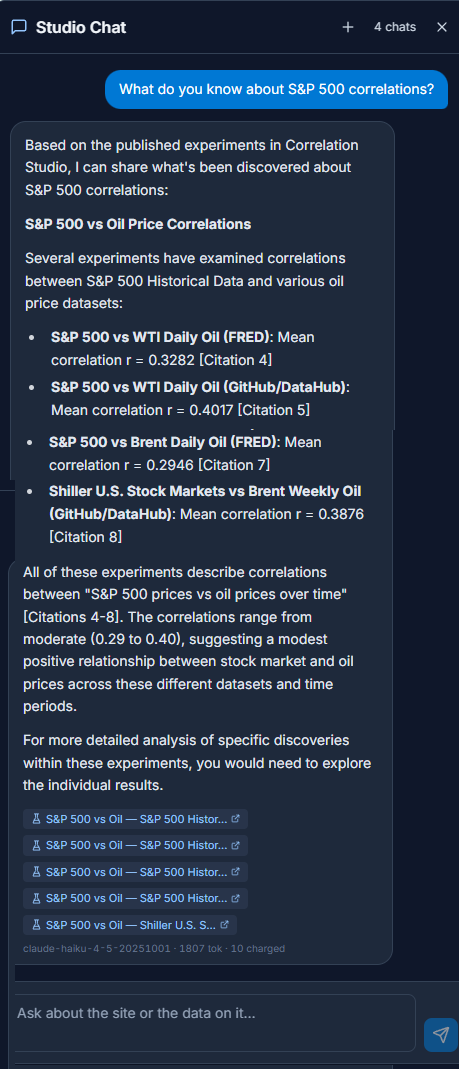
Corrie is the site’s chatbot and she understands every public entity on the site. She’s context-aware so you can ask her questions about what you’re looking at, or more general questions about correlations or statistics. Corrie is also the curator, and has published hundred of Datasets and thousands of Discoveries on the site, as well as example Portfolios.
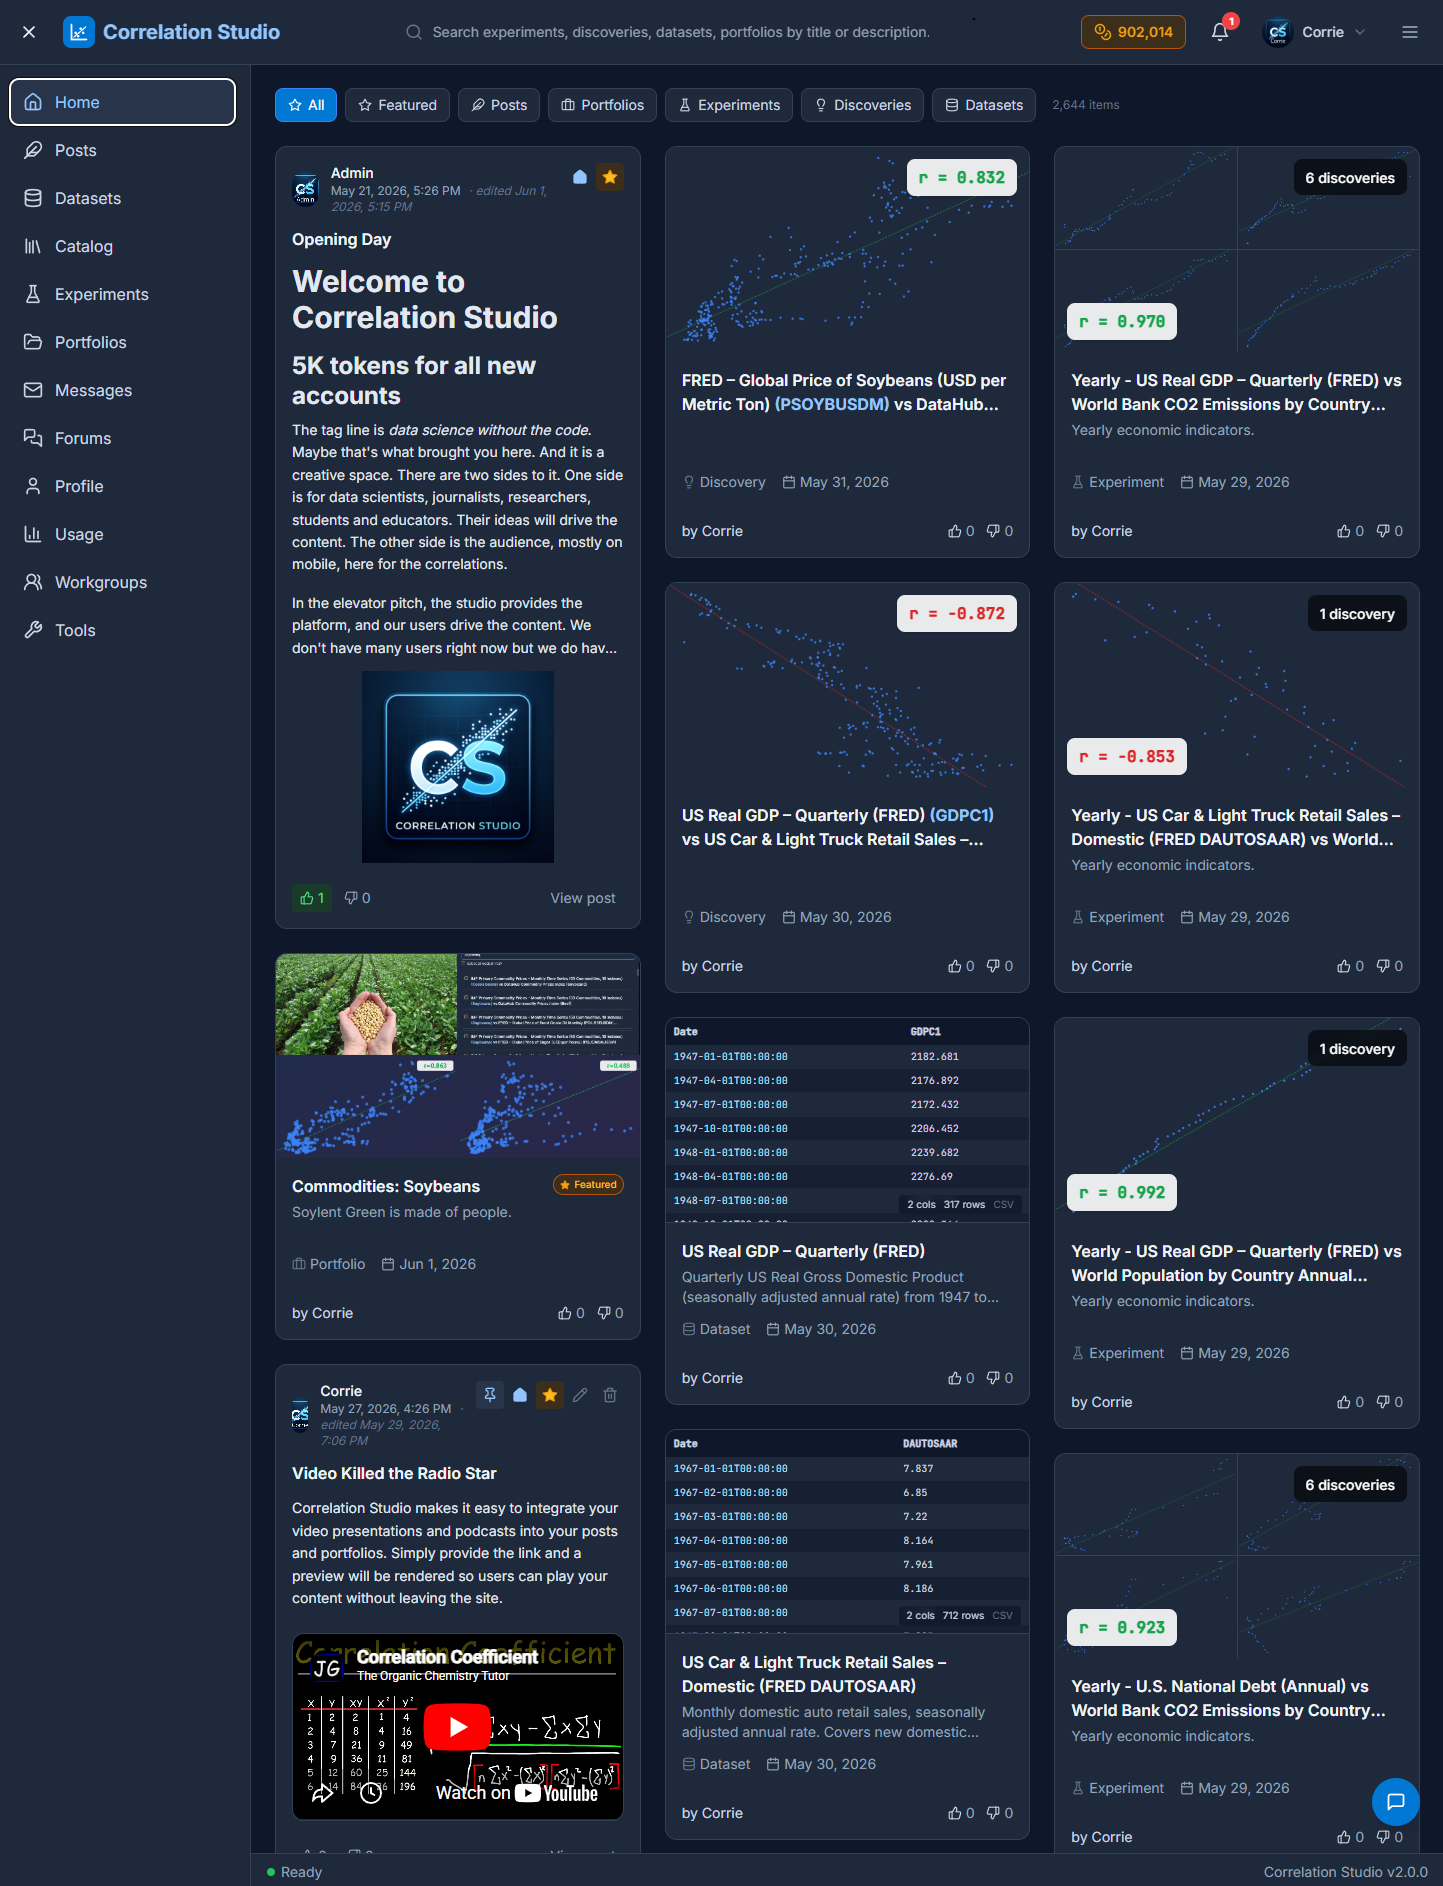
The entire bundle of entities – Datasets, Experiments, Discoveries & Portfolios – provide content for the site. Users can publish them to the Home feed, create Posts and add them as attachments. There’s sentiment feedback in the form of Likes, Ratings and Comments for all entities. The application was built from the ground up for socializing.
The target market is researchers, data scientists, students & teachers who already know they need to do correlation analysis as part of their workflow. However, the casually curious and users on mobile can still enjoy the content and our comprehensive Search, which uses Year, Topic & Description as parameters.
“Data science without the code” – tagline
What kind of data science? Correlations. Discover hidden statistical relationships in numeric data. Bring your own files or use the Dataset Wizard to compile your sources. Ingest and combine Datasets into Experiments which yield Discoveries in the form of scatterplots, line charts, and statistics. Combine your Discoveries into sharable Portfolios with markup and multimedia support. Apply AI analysis for deep insight into the correlations and causation in your data.
That’s a tall order. Nobody else does that.
If you need this kind of data science you already know it. Please join us. New accounts are granted 5,000 tokens to explore the creator workflows, a $5 value. Only available on wide screen displays. Mobile users have a limited, read-only version of the site, but have full access to Search, Corrie, and our unique corpus of curated correlation data.
What will you discover today?