
2026 US Elections – The Battle for Michigan
Polls, money, early votes, fifty years of history and an AI analysis of what moved, all on one map, every figure sourced. A case study in Mappit’s map apps, through one of the closest-watched races of the 2026 midterms: the open Senate seat in Michigan.
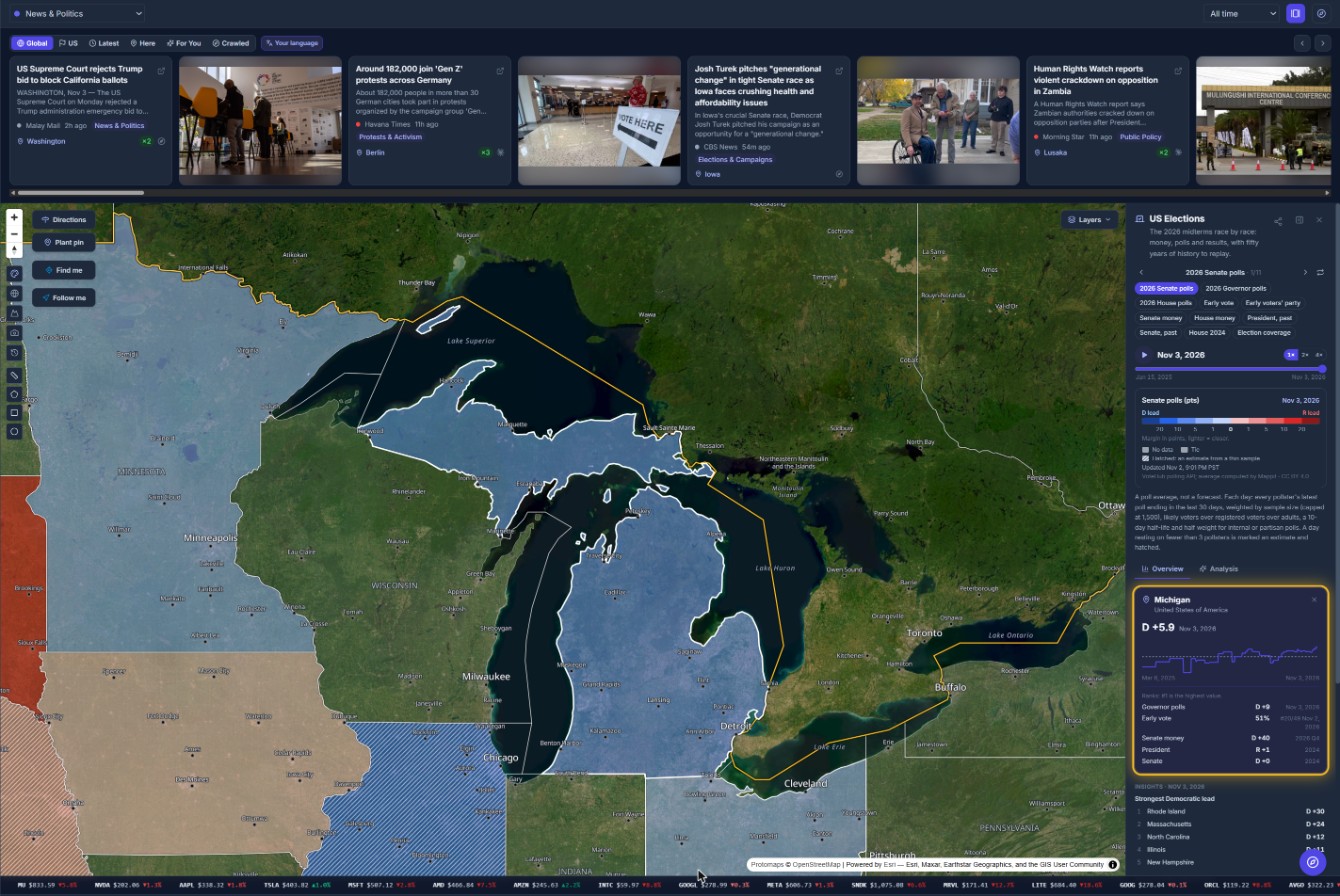
Election coverage usually comes in pieces. The polls are on one site, the fundraising on another, early-vote counts in a spreadsheet, history in an almanac and the news everywhere else. Mappit puts them on one map, side by side, for every 2026 race. Today, as Americans vote in the midterms, here is how that looks for a single race.
Mapplets: data you can paint on the world
Mappit is a live map of the world’s news. Its mapplets are data layers on that map: open one from the Layers menu and the countries, states, counties or congressional districts take on the colours of a statistic. There are eight today: Conflict & Crisis, Environment, Health, News Atlas, People, US Economy, US Elections and World Economy. Between them they hold about a hundred views over 115 indicators and some 6.6 million data points, all from open sources licensed for reuse.
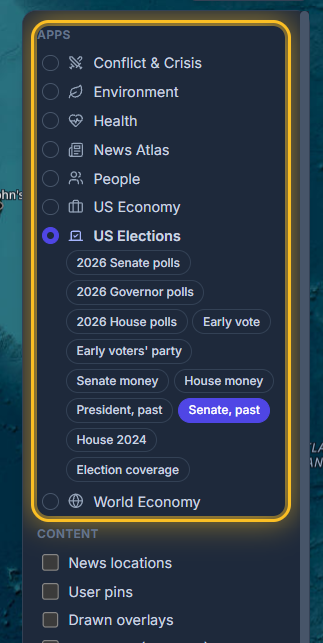
Every app works the same way. Pick a view and the map repaints. Press play and the timeline replays it day by day, month by month or election by election. Select a place and the panel shows its figure, its trend, its rank and its numbers in the app’s other views. Every legend names its source and license. And the Analysis tab turns the view on screen into a written briefing.
The US Elections app has eleven views: 2026 polls for the Senate, governors and the House; the early vote and the party of early voters; Senate and House money; and past results for President, the Senate and the House, back to 1976. Every 2026 race, 506 of them, has its own page.
Michigan, one view at a time
Michigan’s Senate seat is open: Gary Peters is retiring. The nominees are Democrat Abdul El-Sayed and Republican Mike Rogers, who came within a third of a point of winning the state’s other Senate seat in 2024. Here is the race the way the map tells it.
1. The polls: D +5.9, and climbing
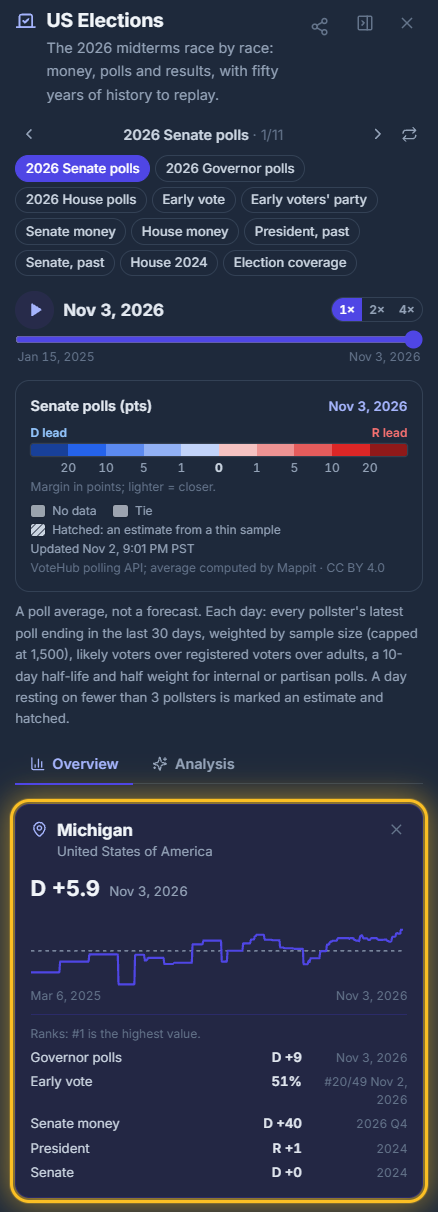
Mappit’s poll average has El-Sayed ahead by 5.9 points on 11 polls. It is a poll average, not a forecast, and the panel says exactly how it is made: each day, every pollster’s latest poll ending in the last 30 days, weighted by sample size, likely voters over registered voters over adults, with a ten-day half-life and half weight for internal or partisan polls. A day that rests on fewer than three pollsters is marked as an estimate and hatched on the map.
The line behind the number goes back to March 2025. It has run from a Republican lead of 9.3 points to today’s Democratic lead of 5.9, the high point of the race.
2. The analysis: what moved, and why it might look that way
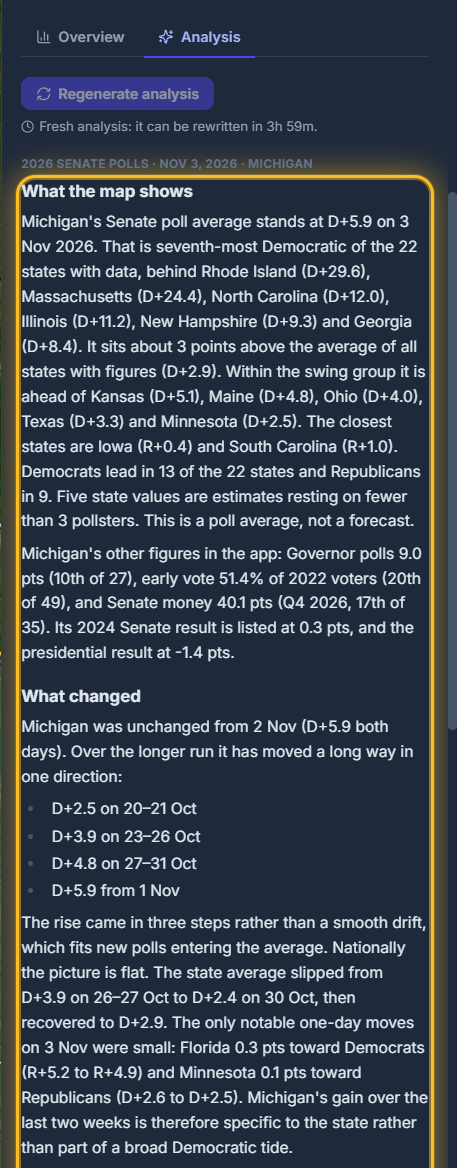
Open the Analysis tab and Claude, Anthropic’s AI, reads the figures on the map, how they moved, the trend and the news about the place, thinks it through and writes what it sees. Plus members can generate one; once written, everyone can read it. Today’s analysis of Michigan noticed something a glance at the number would miss:
The rise came in three steps rather than a smooth drift, which fits new polls entering the average. Nationally the picture is flat. […] Michigan’s gain over the last two weeks is therefore specific to the state rather than part of a broad Democratic tide.
Mappit analysis, 2026 Senate polls, Michigan, November 3, 2026
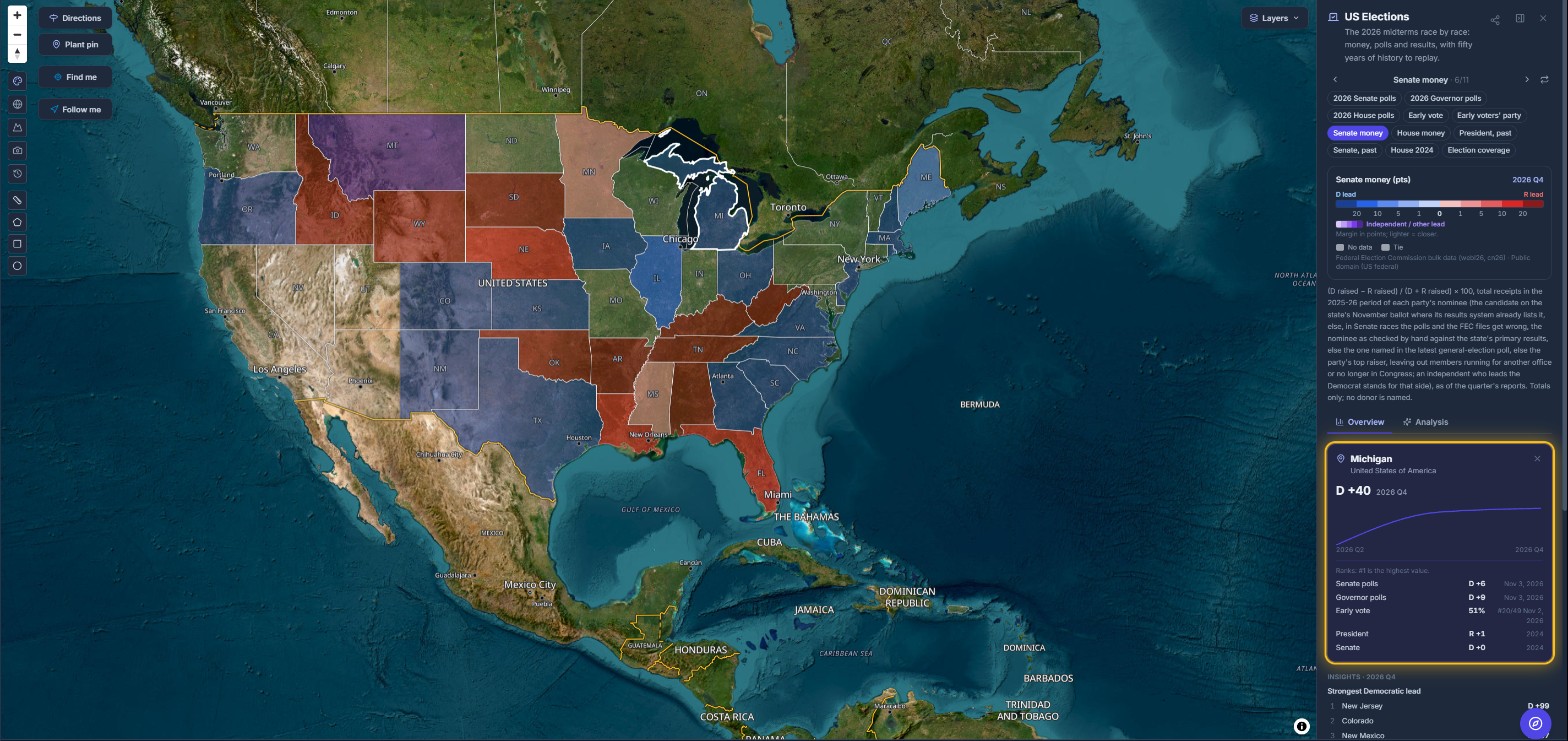
3. The money: D +40
Switch to Senate money and the map shows which side has raised more in each race, from the Federal Election Commission’s own filings. In Michigan, El-Sayed had raised $53.8 million to Rogers’s $23.0 million in their October filings, a 40-point Democratic edge in the money. Totals only; Mappit never names donors.
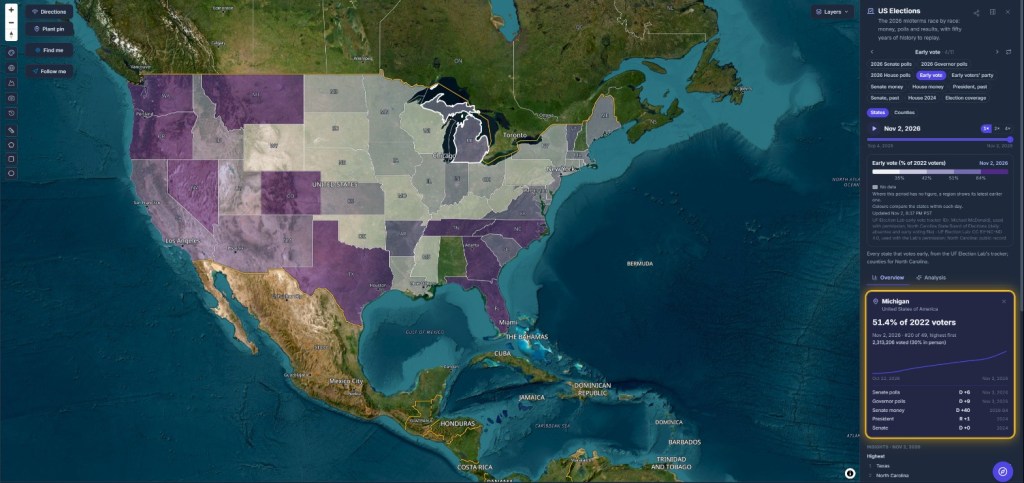
4. The early vote: 2.3 million ballots already in
By Monday, 2,313,206 Michiganders had already voted: 51.4% of everyone who voted in 2022, up from 34.5% just five days earlier, and 30% of them in person. The Early vote view tracks every state that votes early from the University of Florida Election Lab’s tracker by Dr. Michael McDonald, and North Carolina county by county from the state’s own files. This week Mappit checks for new figures every ten minutes.
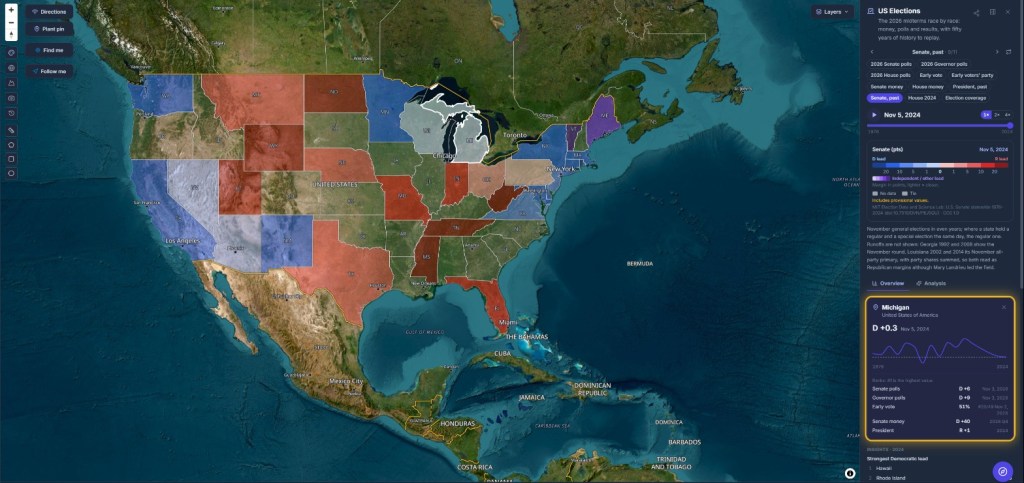
5. The history: fifty years of Senate races
The past-results views go back to 1976, from MIT’s Election Data and Science Lab. Michigan’s Senate line swings through five decades before landing on 2024’s margin of 0.3 points, the race Rogers lost, the same year Donald Trump carried the state by 1.4. Press play and every state’s Senate result replays, election by election.
The news beside the numbers
Because the apps sit on Mappit’s news map, the stories are never more than a glance away. The strip above the map carries the day’s coverage, filtered by topic and place, and Mappit groups related stories into storylines as they develop. The Election coverage view even maps how much of each state’s news is about the campaign.
Tonight, and the morning after
As polls close and state election offices publish their counts, Mappit reads results from their own feeds and adds them to the map as they are reported. Mappit never calls a race. And because every view keeps every day, the whole campaign stays on the timeline afterwards: from the first poll of 2025, through the early vote, to the count.
Ask your AI assistant
The same figures are open to AI assistants. Connect Claude, ChatGPT or another assistant to Mappit’s MCP server, free and without an account, and ask “How is Michigan’s Senate race polling?” or “Which states have the highest early vote?” The answer comes from the same data, with its source and a link back to the map.
See it for yourself
Every view in this post is live on mappit.ai today, and free to explore. Start with Michigan’s Senate race, then pick any state, district or race you follow.
Sources and licences
- Polls: VoteHub polling API (CC BY 4.0); average computed by Mappit.
- Money: Federal Election Commission bulk data (public domain).
- Early vote: UF Election Lab early vote tracker (Dr. Michael McDonald), used with permission; North Carolina State Board of Elections (public record).
- Past results: MIT Election Data and Science Lab (CC0).
- Analysis: written by Claude (Anthropic) from the figures on the map and Mappit’s news, at a member’s request.
- Figures as of November 2 and 3, 2026.

